Note
Click here to download the full example code
PyQtGraph Example
Basic PyQtGraph example.
from qtpy import QtWidgets
import numpy as np
import pyqtgraph as pg
import pyqtgraph.opengl as gl
Usually the first thing is to create a QApplication instance. Some
high-level functions do this for you, but you’ll typically need to get the
application instance in order to call exec_() at the end of your script
anyway.
app = pg.mkQApp()
A high-level plot call:
pg.plot([1, 2, 3, 4, 5], [1, 4, 9, 16, 25])
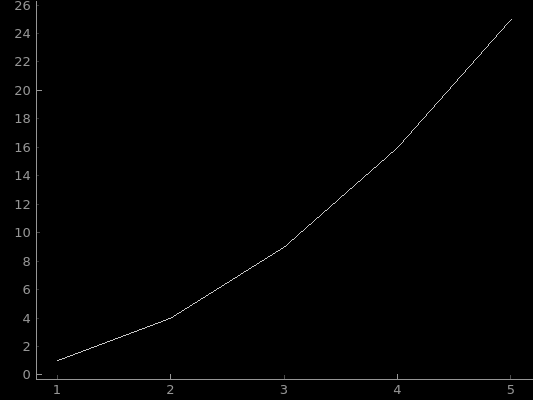
Out:
<pyqtgraph.widgets.PlotWidget.PlotWidget(0x562e039a6630) at 0x7faa7775c910>
OpenGL examples won’t generally work with a headless X server unfortunately:
w = gl.GLViewWidget()
g = gl.GLGridItem()
data = np.array([[0, 0, 0], [1, 0, 0], [1, 0, 1], [0, 0, 2]])
sp = gl.GLScatterPlotItem(pos=data, color=(1, 1, 1, 1), size=10)

w.addItem(g)
w.addItem(sp)
w.show()

app.exec_()
Total running time of the script: ( 0 minutes 1.440 seconds)